Company
Interactive Demos
Monitor


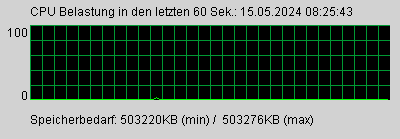
This demo graphically represents the percentage of the Jetty Web Server's current CPU-load, which provides the web-sites of this homepage. Every 0.5 seconds one measurement will be performed, which results in 120 measuring points - given an interval of 60 seconds. The image is updated approx. every 15 seconds on the screen.
Remark
By means of the JNI (Java Native Interface) this demo accesses the PDH (Performance Data Helper) library of the Windows operating system, on which this Jetty Web Servers runs. Microsoft developed the PDH to encapsulate the existing »Low-Level Perfomance Monitoring«-capabilities of the operating system in form of a library. This library operates string-oriented - e.g. the following string would determine the CPU-load: "\Processor(0)\% Processor Time". To facilitate understanding, here is a short Java code fragment, which accesses the PDH-Library by interacting with the JNI.
...
WinPerfMon  monitor = new WinPerfMon();
if(!monitor.addCounter("\\Prozess(java)\\Prozessorzeit (%)")) {
    // error handling
}
if(!monitor.addCounter("\\Prozess(java)\\Private Bytes")) {
    // error handling
}
int[] vec = monitor.getCounterValues();
System.out.println(
  "Processor time:  " + vec[0] + " Memory requirements  (KB):" + vec[1] / 1024
);
...
|
This example displays the CPU-load and the memory requirements of the running Java>-program on screen. This code is meant to demonstrate that it is possible to use Java for the development of efficient programs that are related to operating systems.